Dubai property intelligence
Dubai property,
measured.
Price, yield and transaction intelligence for Dubai's principal freehold communities, with investment tools and buyer guidance for investors across South Asia and the Gulf.
Dubai · 40 tracked areas
Median price per sq ft, Jul–Sept 2026
- Dubai MarinaAED 2,029▼ -2.6%
- Downtown DubaiAED 2,578▼ -5.3%
- Business BayAED 2,090▼ -6.7%
- Jumeirah Village CircleAED 1,410▼ -4.4%
- Dubai Hills EstateAED 2,277▼ -1.4%
- Jumeirah Lake TowersAED 1,508▼ -0.9%
- Dubai Creek HarbourAED 2,536▼ -4.3%
- Palm JumeirahAED 3,190▼ -5.0%
- Dubai Silicon OasisAED 1,359▲ +1.0%
- ArjanAED 1,557▼ -1.9%
- Motor CityAED 1,748▼ -1.8%
- Dubai Sports CityAED 1,211▼ -0.8%
- Al FurjanAED 1,337▼ -1.8%
- Damac HillsAED 1,791▼ -3.8%
- Sobha HartlandAED 2,128▼ -1.1%
- Town SquareAED 1,319▼ -3.7%
- Jumeirah Village TriangleAED 1,582▲ +0.2%
- International CityAED 1,018▼ -4.2%
- Dubai Production CityAED 1,408▼ -0.7%
- Discovery GardensAED 894▼ -6.5%
- MajanAED 1,420▼ -5.7%
- Dubai SouthAED 1,703▲ +0.7%
- Dubai IslandsAED 2,481▼ -1.2%
- Dubai Land Residence ComplexAED 1,365▼ -3.3%
- City of ArabiaAED 1,711▲ +1.3%
- Damac LagoonsAED 1,694▼ -4.1%
- Damac IslandsAED 1,854▼ -6.6%
- MeydanAED 2,052▼ -5.3%
- Al JaddafAED 1,943▼ -5.4%
- Downtown Jebel AliAED 1,700▼ -3.1%
- Dubai Science ParkAED 1,725▼ -7.1%
- Dubai Studio CityAED 1,524▼ -1.2%
- Dubai Maritime CityAED 3,206▲ +1.2%
- Al SatwaAED 2,204▲ +3.1%
- The ValleyAED 1,357▼ -5.6%
- Arabian Ranches IIIAED 1,743▼ -9.3%
- MudonAED 1,723▼ -2.3%
- The Springs & The MeadowsAED 1,606▼ -3.6%
- VillanovaAED 1,411▼ -7.7%
- Dubai HarbourAED 3,589▼ -3.6%
Market intelligence
Price, yield and liquidity for Dubai's principal freehold communities, updated monthly.
Investment modelling
Payment plans, net yield and affordability, modelled in AED and INR.
Buyer guidance
Remittance, financing, tax and ownership, for investors buying from overseas.
Price Check
Grade any quote against registered sales of similar homes, with a confidence score.
01 · Communities
Dubai's principal freehold communities
From established waterfront districts to master-planned family communities.
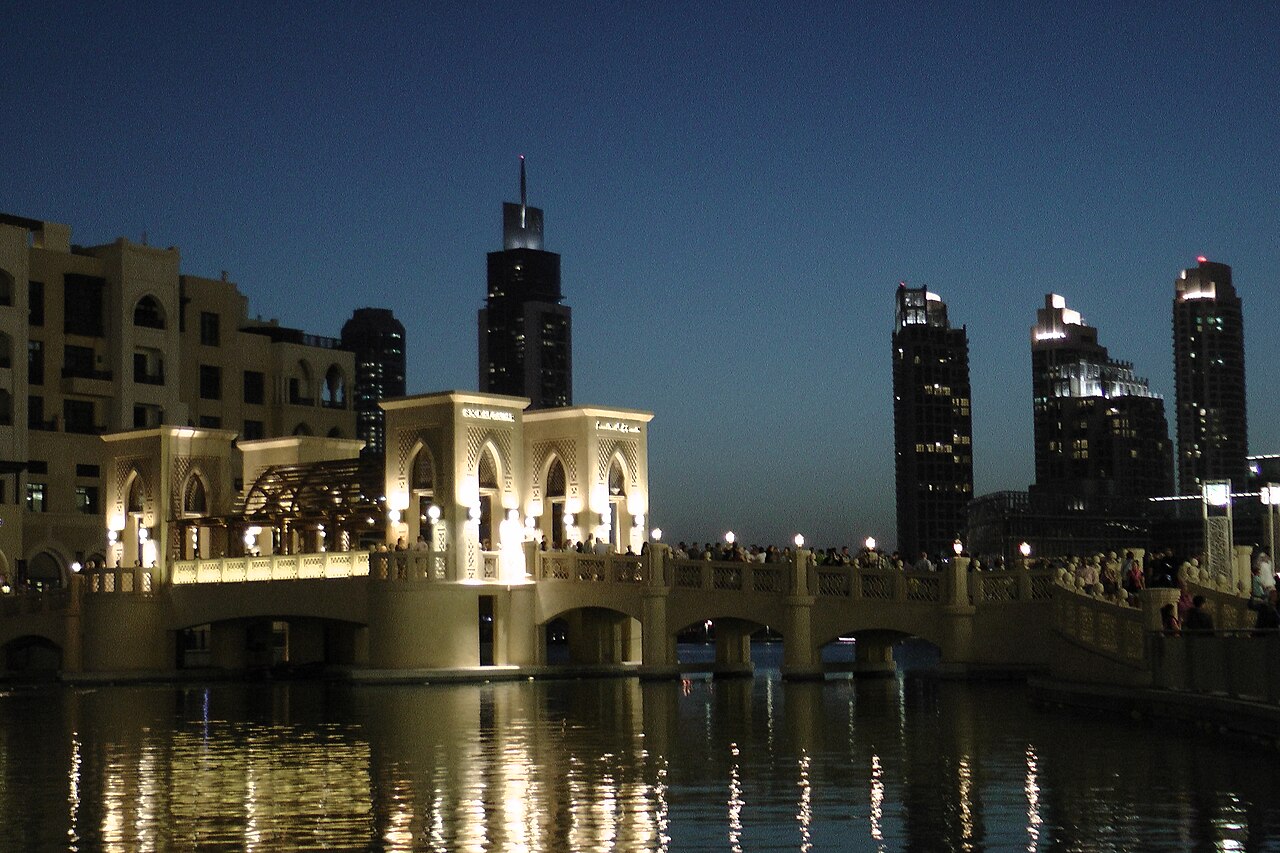
Ultra-prime
Downtown Dubai
Dubai's central showcase district around Burj Khalifa, with premium pricing and lower gross yields.
- Price / sq ft
- AED 2,578
- Gross yield
- 5.0%
- Like-for-like
- -5.3%
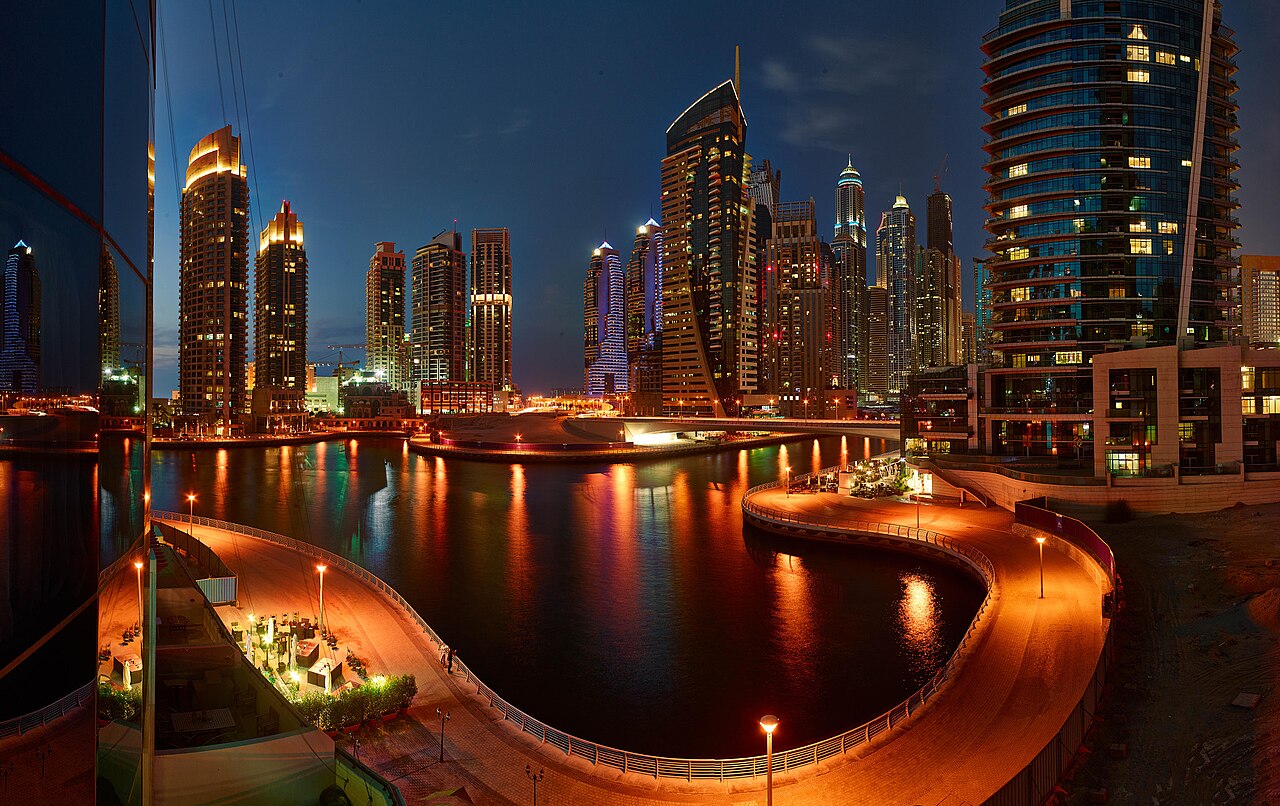
Prime
Dubai Marina
- Price / sq ft
- AED 2,029
- Gross yield
- 5.8%
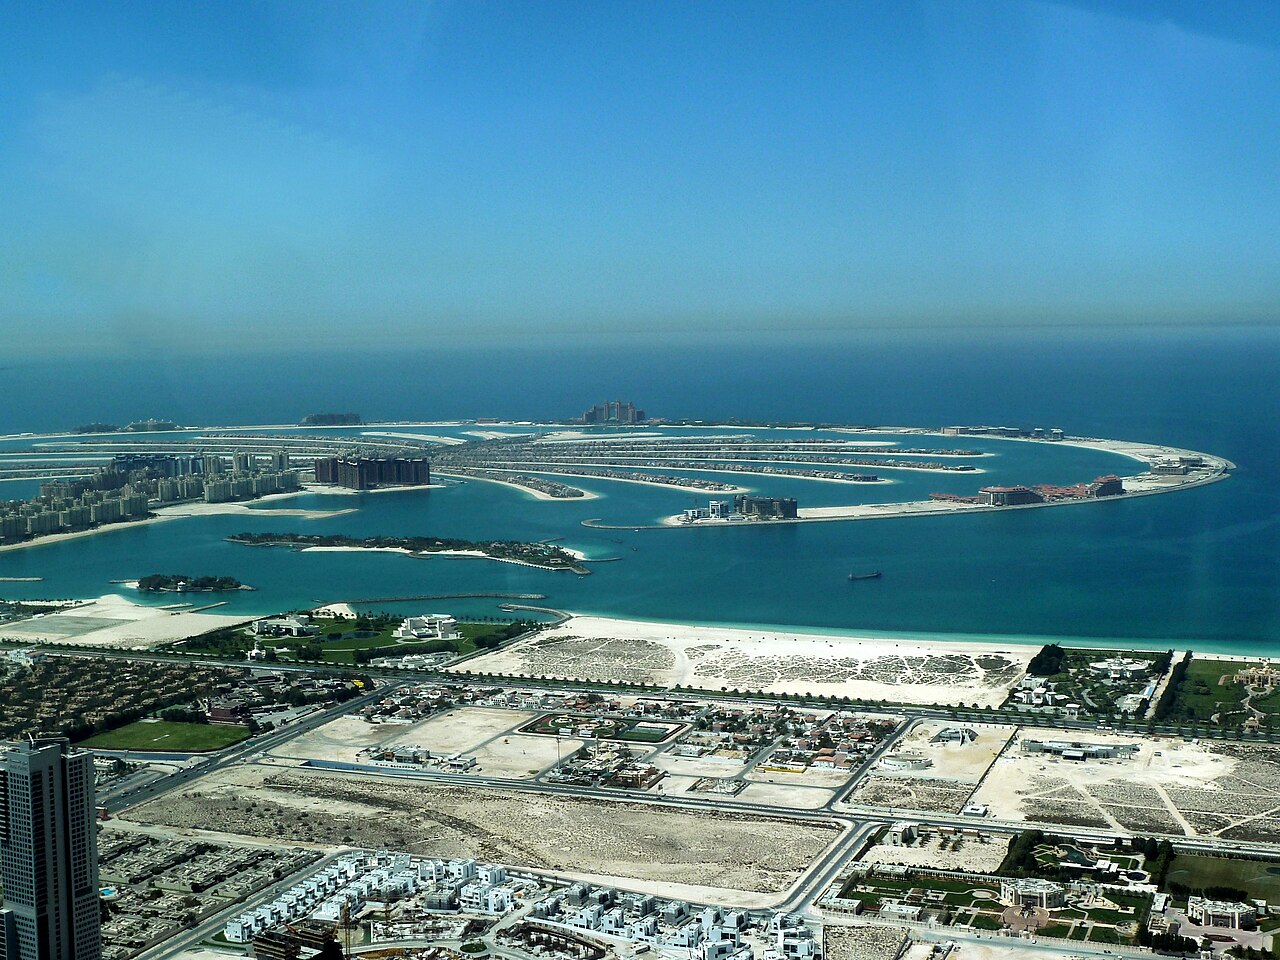
Ultra-prime
Palm Jumeirah
- Price / sq ft
- AED 3,190
- Gross yield
- 4.8%
Prime
Dubai Hills Estate
- Price / sq ft
- AED 2,277
- Gross yield
- 5.9%
Value
Jumeirah Village Circle
- Price / sq ft
- AED 1,410
- Gross yield
- 7.5%
02 · Market data
Where Dubai's market is moving
Ranked by price, price change, gross yield and sales volume, from Dubai Land Department registered transactions (Jan–Sept 2026). Select any area for its monthly history.
- 01Al SatwaPrime93.4% off-plan+3.1%
- 02City of ArabiaMid-market99.0% off-plan+1.3%
- 03Dubai Maritime CityPrime98.4% off-plan+1.2%
- 04Dubai Silicon OasisValue69.0% off-plan+1.0%
- 05Dubai SouthValue94.4% off-plan+0.7%
- 06Jumeirah Village TriangleValue85.4% off-plan+0.2%
- 07Dubai Production CityValue76.7% off-plan-0.7%
- 08Dubai Sports CityValue59.9% off-plan-0.8%
- 09Jumeirah Lake TowersMid-market42.6% off-plan-0.9%
- 10Sobha HartlandPrime58.7% off-plan-1.1%
- 11Dubai IslandsPrime100.0% off-plan-1.2%
- 12Dubai Studio CityValue72.6% off-plan-1.2%
- 13Dubai Hills EstatePrime55.3% off-plan-1.4%
- 14Motor CityMid-market80.6% off-plan-1.8%
- 15Al FurjanValue51.9% off-plan-1.8%
- 16ArjanValue64.6% off-plan-1.9%
- 17MudonMid-market29.8% off-plan-2.3%
- 18Dubai MarinaPrime7.8% off-plan-2.6%
- 19Downtown Jebel AliMid-market89.8% off-plan-3.1%
- 20Dubai Land Residence ComplexValue91.0% off-plan-3.3%
- 21The Springs & The MeadowsMid-market0.0% off-plan-3.6%
- 22Dubai HarbourUltra-prime55.1% off-plan-3.6%
- 23Town SquareValue14.8% off-plan-3.7%
- 24Damac HillsMid-market64.5% off-plan-3.8%
- 25Damac LagoonsMid-market100.0% off-plan-4.1%
- 26International CityValue49.6% off-plan-4.2%
- 27Dubai Creek HarbourPrime70.9% off-plan-4.3%
- 28Jumeirah Village CircleValue58.4% off-plan-4.4%
- 29Palm JumeirahUltra-prime37.5% off-plan-5.0%
- 30Downtown DubaiUltra-prime29.5% off-plan-5.3%
- 31MeydanPrime31.9% off-plan-5.3%
- 32Al JaddafMid-market77.4% off-plan-5.4%
- 33The ValleyValue48.6% off-plan-5.6%
- 34MajanValue83.6% off-plan-5.7%
- 35Discovery GardensValue0.0% off-plan-6.5%
- 36Damac IslandsMid-market100.0% off-plan-6.6%
- 37Business BayPrime54.2% off-plan-6.7%
- 38Dubai Science ParkMid-market89.4% off-plan-7.1%
- 39VillanovaValue43.7% off-plan-7.7%
- 40Arabian Ranches IIIMid-market30.8% off-plan-9.3%
The trade-off
Price or yield. Rarely both.
Prime addresses cost more per square foot and usually return less rent on the money you put in. Value communities often yield more, with more new homes arriving. This chart shows where each area sits, and the lists below group every area.
- Top-left: lower entry price, higher gross yield
- Bottom-right: premium address, long-term value
- Bigger circle: more transactions, easier to buy and sell
Price per sq ft vs gross yield
OfficialIncome-focused · 11
Lower entry price, higher yield
- International City1,018 · 8.6%
- Dubai Sports City1,211 · 8.4%
- Dubai Land Residence Complex1,365 · 8.3%
- Arjan1,557 · 7.8%
- Jumeirah Village Triangle1,582 · 7.8%
- Dubai Production City1,408 · 7.7%
- Dubai Studio City1,524 · 7.7%
- Jumeirah Village Circle1,410 · 7.5%
- Dubai Silicon Oasis1,359 · 7.5%
- Al Furjan1,337 · 7.4%
- Majan1,420 · 7.2%
Premium address · 11
Higher price per sq ft, long-term value
- Dubai Harbour3,589 · 4.8%
- Palm Jumeirah3,190 · 4.8%
- Downtown Dubai2,578 · 5.0%
- Dubai Creek Harbour2,536 · 5.5%
- Dubai Hills Estate2,277 · 5.9%
- Sobha Hartland2,128 · 6.1%
- Business Bay2,090 · 6.5%
- Meydan2,052 · 6.9%
- Dubai Marina2,029 · 5.8%
- Al Jaddaf1,943 · 6.6%
- Motor City1,748 · 7.1%
Balanced · 4
A mix of price and yield
- Damac Hills1,791 · 7.2%
- Dubai South1,703 · 7.2%
- Town Square1,319 · 7.1%
- Jumeirah Lake Towers1,508 · 7.0%
03 · Tools
Model the investment before you commit
Calculators covering the full cost of ownership, from DLD fees to net yield.
Off-plan payment plan calculator
Cash required at each milestone from booking to handover, including DLD fees, in AED and INR.
Open toolRental yield & ROI calculator
Gross vs net yield after service charges, vacancy and fees, pre-filled with area data.
Open toolWhat can I afford?
From a rupee budget to a Dubai purchase price, with LRS and TCS applied.
Open toolGolden Visa eligibility checker
Check whether a property purchase could qualify you for the UAE 10-year Golden Visa.
Open toolBuyer hubs
Guidance for buying from overseas
Remittance, financing, tax and ownership rules, set out for each home market.
04 · Developers
Developer profiles
Ownership, flagship communities and market positioning of Dubai's leading developers.
05 · Methodology
Methodology
Built on registered transactions and a published method, with every figure dated and classified.
- 01
Registered records
Official Dubai Land Department records of registered sales and tenancy contracts.
- 02
Consistent measures
Typical prices, like-for-like trends and yields, produced the same way for every area.
- 03
Dated and classified
Each figure carries its source, as-of date and classification: official or estimated.
Free · Monthly
Get the monthly Dubai report
Prices, yields and volumes for the areas that matter, in one short email on the first week of each month. No spam, unsubscribe anytime.
Free Price Check
Got a quote? See what similar homes actually sold for.
Registered Dubai Land Department sales for the same area, home type and status: the typical range, a confidence score and an estimated net yield, in AED and INR.